Brand block on planograms where possible. Keeping brands together leads to increased sales and easier customer shopping experience.
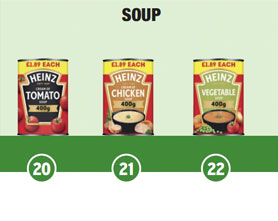
Higher rate of sale categories e.g. baked beans, soups, canned fish should be placed at eye level on shelf.
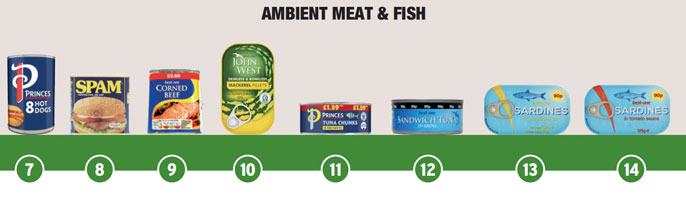
Tuna is the biggest sub-sector sector in canned fish, accounting for over 62% of total canned fish sales.**
*(Kantar WPO, Gold Report, Shopper Penetration, 52 w/e May 2023)
**(Nielsen, Total Market Value Sales, 52 w/e May 2023)
This makes it bigger than baked beans (£416m), ambient soup (£397m) and canned meat (£325m).**
*(Nielsen, Total Market Value Sales, 52 w/e May 2023)
** (Kantar WPO, Gold Report, Shopper Penetration, 52 w/e May 2023)
(w/e 22 May 2021 for IRI & 16 May 2021 for Kantar)
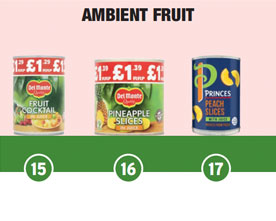
71% of canned fruit sales are in juice, 23% in syrup with the remaining 6% in other dressing types.
(MAT, AC Nielsen April 2023)
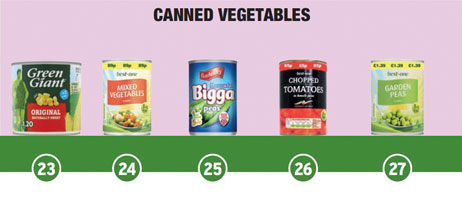
Chopped tomatoes make up over half of canned tomato sales (54%), followed by Passata (16%), Puree (15%) and Plum (12%).
Private label accounts for 59% of canned tomato sales YTD, up from 55.8% LY.
*(MAT Total Market, AC Nielsen March 2023)
**(YTD, Groc Mults, AC Nielsen March 2023)
A recent study found a third of shoppers intended to buy more canned goods in 2023.
(Research from consultancy KICR and Princes (Sept 2022))
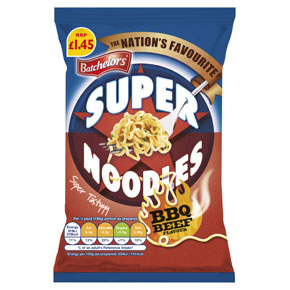
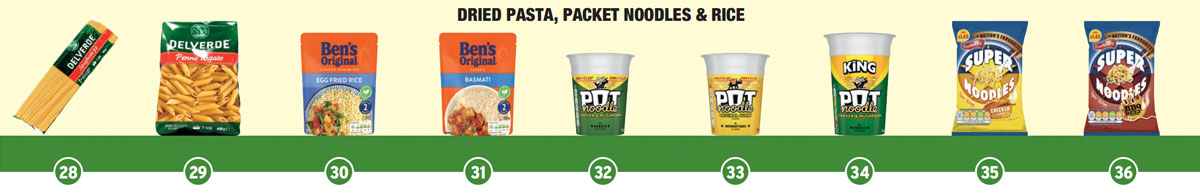
The category is broken into two key segments. Pot snacks account for 76% of all sales and block noodles account for 24%. This means that pot snacks account for almost £8 in every £10 spent on instant hot snacks.
(Nielsen Total Market Value 52 weeks to 22nd April 2023)
(Nielsen Total Market Value Sales 52 weeks to 22nd April 2023)
As canned fish is recognised for its versatility, it's a good idea to use off shelf display to drive impulse sales on promotions. People eat canned fish all year round – in sandwiches, salads and pasta bakes – giving plenty of opportunities to maximise sales.
Important to cover all major fish before duplicating. Shoppers are particular about fish type, if they want mackerel they are unlikely to settle for tuna.
Provide a range of all carriers as well, shoppers are habitual and care whether packed in brine, tomato or sunflower oil.
Brand block on planograms where possible. Keeping brands together leads to increased sales and easier customer shopping experience.
Higher rate of sale categories e.g. baked beans, soups, canned fish should be placed at eye level on shelf.
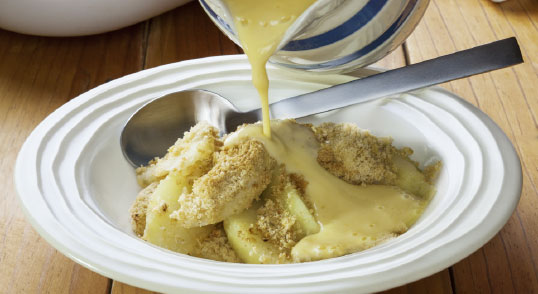
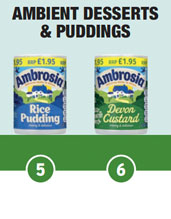
Dessert sales are at their highest during colder months and at key seasonal occasions such as Easter and Christmas.
Especially in winter, stock up on Ambrosia custard and site this alongside desserts such as sponge puddings to drive incremental sales.
Return to recessionary behaviour.
Shoppers becoming savvier due to uncertainty, value for money becomes even more important.
Consider price mark and own label products that offer great value and margins.
Fulfil different basket missions.
Snack meals satisfy different meal occasions: Pots and soup are primarily consumed at lunchtime and sachet (pasta and rice) at dinner time.
Offering the right products on the shelves with a good range will give shoppers the confidence to find what they want if they take a trip to a convenience store.
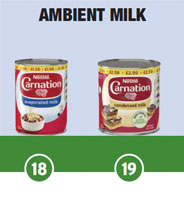
Optimise key events with Carnation SCM e.g. Easter, Bake Off and Christmas.
Where possible dual merchandise Carnation SCM with baking ingredients to drive basket size and spend.
Information correct at time of print.
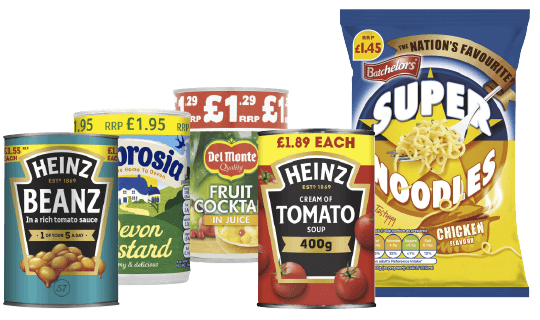
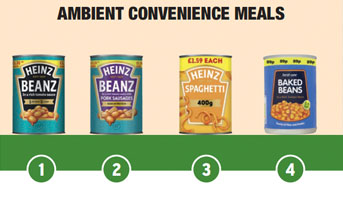
These are the ‘Must Stock’ lines which shoppers expect to see in a convenience store. By stocking these lines, you will be meeting your customers’ needs and therefore they will visit your store again.
We suggest you stock the following range:
1
2
3
4
5
6
7
8
9
10
11
12
13
14
15
16
17
18
19
20
21
22
23
24
25
26
27
28
29
30
31
32
33
34
35
36